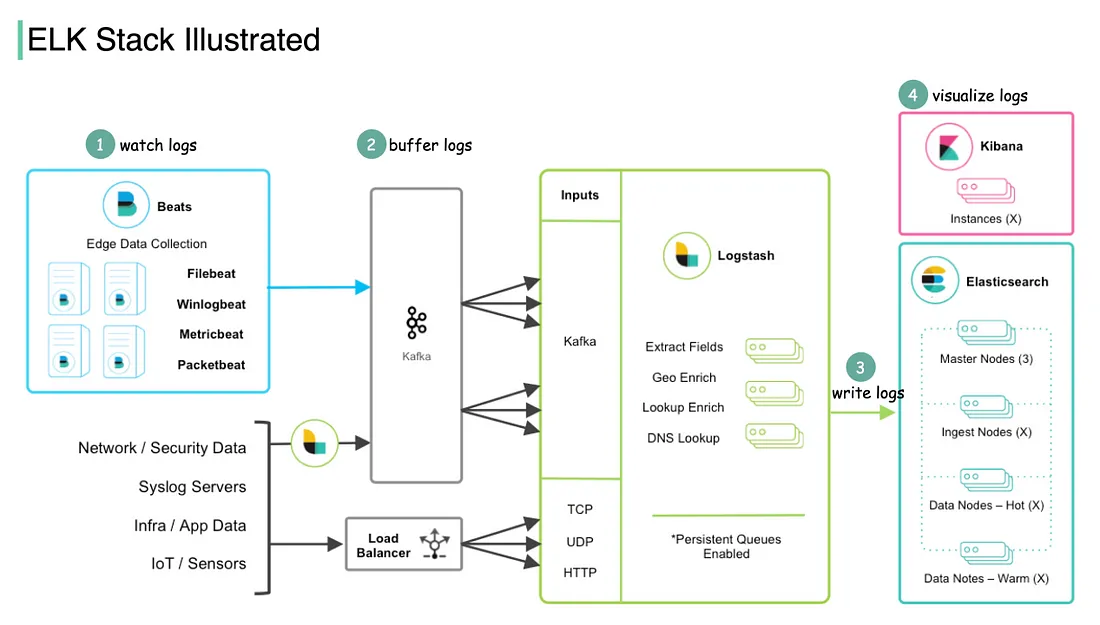
Elasticsearch is a distributed search and analytics engine built on Apache Lucene. Since its launch in 2010, it has become the leading search engine, widely used for log data analysis, full-text search, security intelligence, business analytics, and operational intelligence.
As the core of the ELK stack, Elasticsearch enables users to uncover valuable insights from vast data sets that might otherwise seem insignificant. Unlike traditional data warehouses, where data often goes unused, Elasticsearch helps extract meaningful information efficiently. In an era of overwhelming data, the challenge lies in making sense of the volume. Companies like Yahoo and Amazon provide large open datasets rich with insights, but analyzing them requires substantial effort and computing power. Mastering the ELK stack allows businesses to transform seemingly mundane data into powerful discoveries.
You may frequently come across the name Lucene. Lucene is an open-source project written in Java, best described as a set of Java libraries designed for full-text search. Originally, Elasticsearch started as an API for Lucene, known as "Compass." It later evolved into a standalone server, allowing users to leverage its capabilities without writing any code. One of Lucene's greatest strengths is its maturity as an open-source project with a well-established codebase. While Lucene has existed for years, Elasticsearch has played a significant role in bringing it into the spotlight and making it widely recognized.
Logstash is a powerful tool designed to process logs and event data from various sources and systems. It is developed using Ruby.
Logstash can process almost any kind of data and normalize it.
Logstash helps standardize data into a common format before forwarding it to a data store, which, in the case of the ELK stack, is Elasticsearch. It plays a crucial role in data normalization, ensuring seamless indexing into Elasticsearch. Logstash is a powerful tool, especially when dealing with unstructured or inconsistent data, making it invaluable for efficient data processing and analysis.
Kibana is a JavaScript-based web application that acts as the frontend interface for visualizing data in an Elasticsearch cluster.
It enables users to execute Elasticsearch queries and visualize the results.
As part of the ELK stack, which includes Logstash for data ingestion and processing, Kibana provides a web-based interface to visualize query results. With the release of Kibana 4.2, plugin installation for both Kibana and Elasticsearch was introduced, enhancing flexibility and usability. This book is designed to help DevOps professionals, system administrators, network administrators, and security experts effectively leverage the ELK stack for operational insights. As systems grow in complexity and networks expand, monitoring uptime and detecting security threats become increasingly vital, especially against potential cyberattacks. While tools like Logwatch help identify anomalies, many open-source security projects, such as Mozilla’s MozDef, are now built on the ELK stack—emphasizing the importance of analyzing collected logs for security and performance monitoring.
This architecture defines a powerful ELK Stack pipeline, incorporating additional components such as Kafka for buffering and Beats for edge data collection. Together, they enable reliable, scalable, and flexible real-time log monitoring and analytics. Each component optimizes data flow—Beats for data collection, Kafka for buffering, Logstash for processing, Elasticsearch for storage, and Kibana for visualization. This setup is ideal for monitoring infrastructure, tracking security events, and detecting anomalies in real-time.
Watch Logs — Data Collection with Beats
Filebeat: Collects log files from various applications.
Winlogbeat: Gathers Windows Event Logs.
Metricbeat: Collects system and service metrics.
Packetbeat: Analyzes network packets to extract network traffic data. Beats function as lightweight agents installed on edge servers or endpoints, responsible for collecting logs, metrics, and network data for further processing.
Buffer Logs — Kafka
Once collected, the data from Beats is forwarded to Kafka, a distributed streaming platform that acts as a buffer layer.
Kafka enables reliable data transfer and efficiently manages large data volumes, preventing loss during high traffic or system disruptions. By buffering logs, it ensures smooth handling of data ingestion spikes.
Load Balancer: Additional sources like network/security data, syslog servers, and IoT sensors can send data directly through a load balancer, ensuring even distribution of incoming data to Kafka.
Process and Write Logs — Logstash
Logstash retrieves data from Kafka and processes it by enriching, filtering, and transforming it before forwarding it to storage. Key processing tasks include:
Extract Fields: Parsing logs to pull out relevant fields for analysis.
Geo Enrich: Enhancing data with geographical details based on IP addresses, enabling location-based event tracking.
Lookup Enrichment & DNS Resolution: Enhancing data with additional contextual information, such as hostname lookups.
Persistent Queues Enabled: Logstash utilizes persistent queues to maintain data integrity, preventing loss during temporary outages.
Write Logs — Elasticsearch
Elasticsearch: After processing, data is stored in Elasticsearch, where it is indexed and structured for fast search and analytics.
The Elasticsearch setup is shown as having multiple node types:
Master Nodes: Oversee the cluster by managing configuration, monitoring cluster state, and coordinating operations.
Ingest Nodes:Handle data transformation if necessary.
Data Nodes:Responsible for storing and indexing data, categorized into Hot and Warm nodes. Hot nodes store recent data for quick access, while Warm nodes retain older data for cost-effective storage.
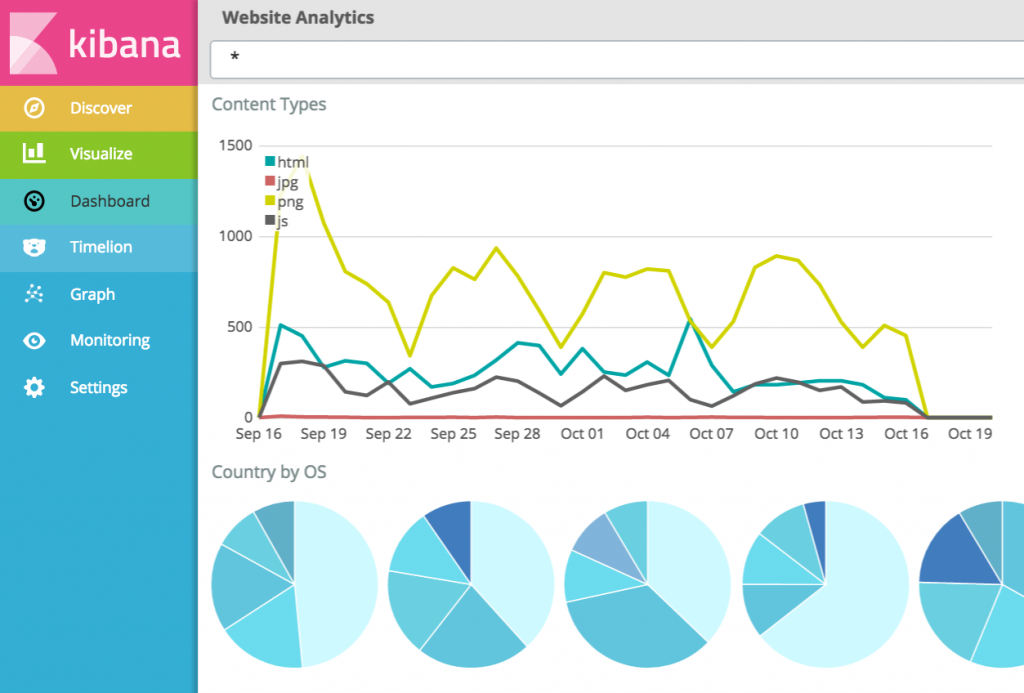
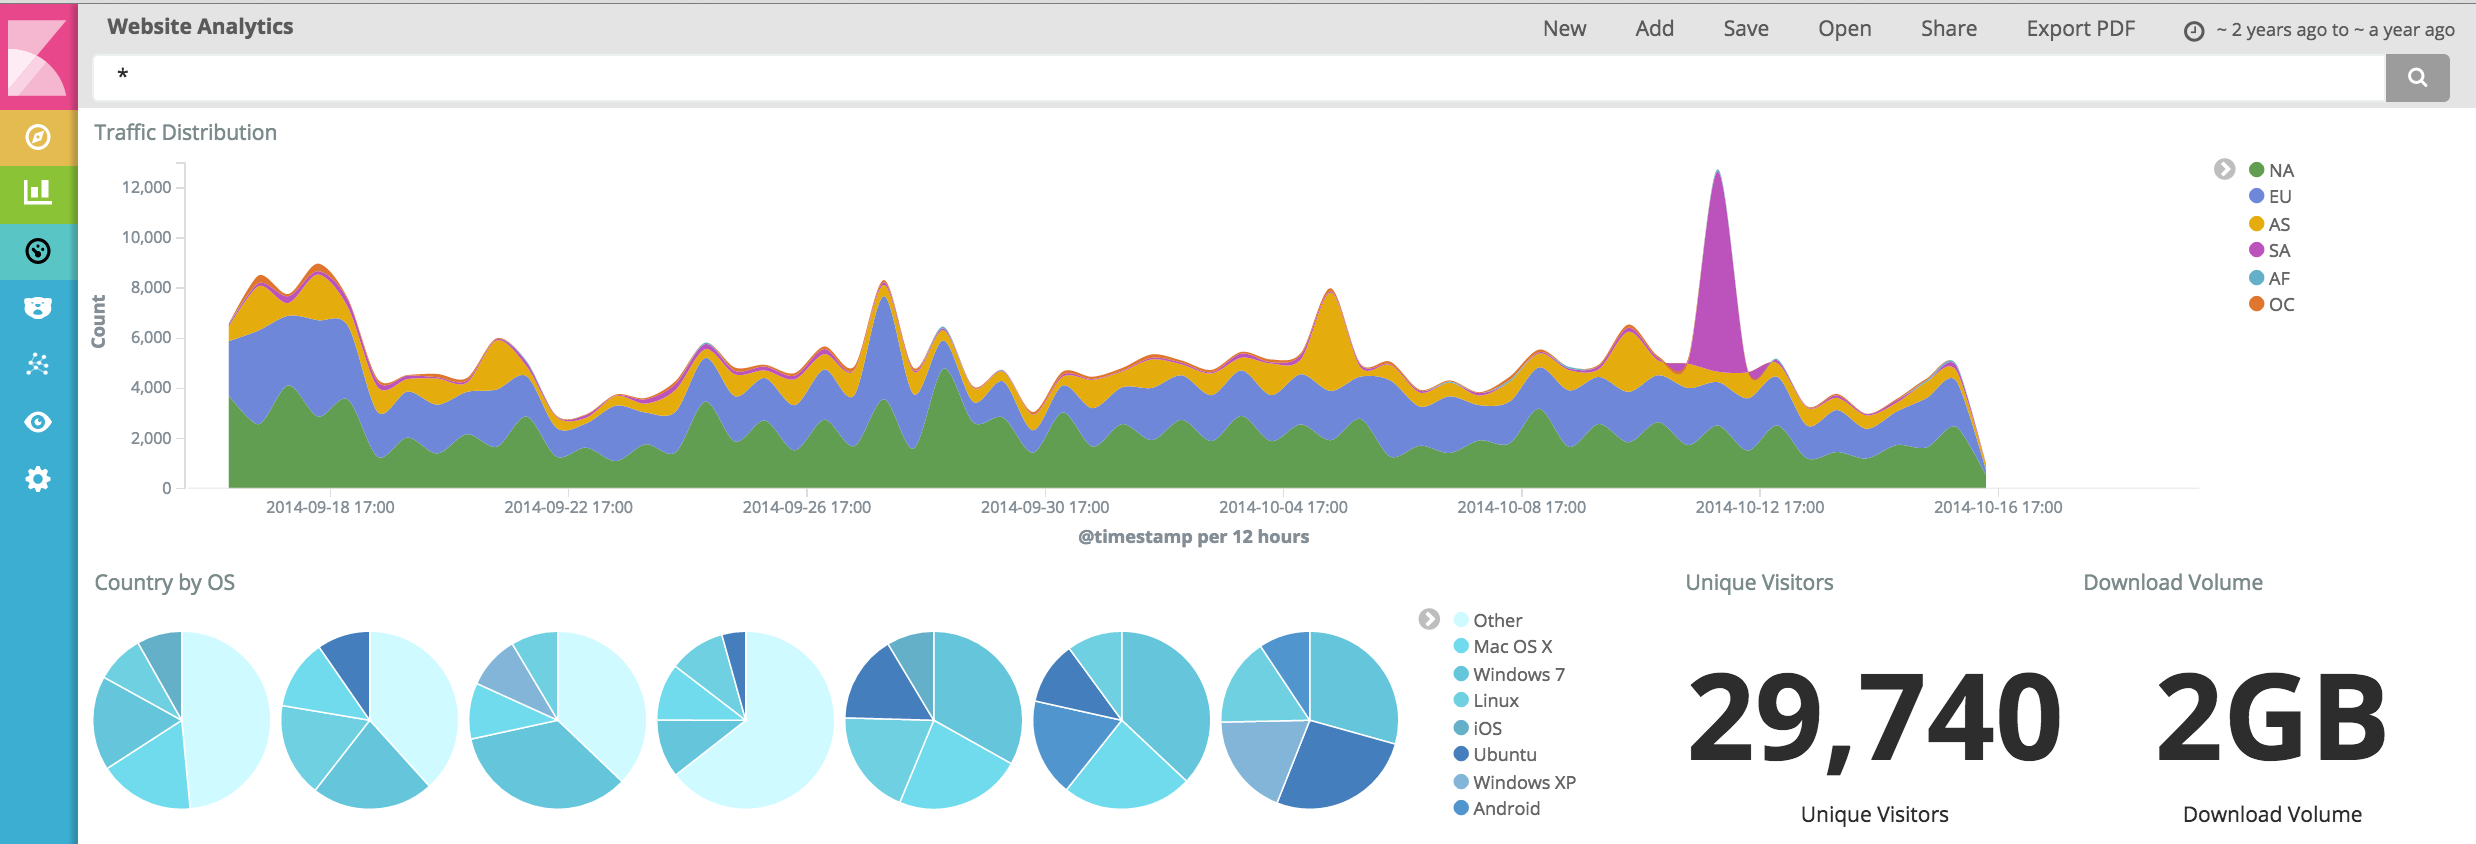
Visualize Logs — Kibana
Serving as the visualization layer and frontend, Kibana enables data analysis through interactive dashboards and graphs. It connects to Elasticsearch, allowing users to search, analyze, and visualize indexed data.
Kibana is essential for monitoring metrics, identifying trends, detecting anomalies, and configuring alerts.
Effective monitoring goes beyond issue detection—it enables rapid, automated responses. The ELK Stack offers powerful alerting and integration capabilities, making it a valuable tool for real-time monitoring and incident management. By setting up alerts and integrating ELK with other incident response systems, organizations can ensure swift and proactive reactions to critical events.
Kibana allows users to create customized alerts triggered by specific thresholds, patterns, or anomaly detections.
These alerts can track various system metrics and log data, allowing teams to proactively identify and resolve potential issues.
Threshold Alerts: Triggered when metrics exceed predefined limits, such as CPU usage surpassing 90%, low disk space, or high response times.
Event-Based Alerts: Alerts can be configured to identify specific log events, such as repeated failed login attempts indicating a potential brute-force attack or an unexpected surge in error logs signaling an application issue.
Anomaly Detection Alerts: With machine learning add-ons, Kibana can automatically identify anomalies in log and metric data, detecting unexpected patterns such as traffic spikes, suspicious IP activity, or sudden shifts in application performance.
To enhance incident response, the ELK Stack integrates with leading incident management and communication tools, ensuring seamless alert delivery.
PagerDuty: ELK alerts can be set to automatically trigger incidents in PagerDuty, ensuring on-call engineers receive real-time notifications for swift incident acknowledgment and response tracking.
Slack and Microsoft Teams: ELK can deliver alerts directly to Slack or Teams channels, instantly notifying relevant teams. These alerts can be customized to include detailed incident information, facilitating faster triage and troubleshooting within collaborative platforms.
Email Notifications: ELK supports email alerts, which can be customized with detailed incident data and recommendations. These alerts are ideal for broad notifications or informing stakeholders who may not actively monitor alerts in tools like PagerDuty or Slack.
For enhanced automation in incident response, ELK can integrate with various tools and systems to initiate actions based on specific alerts:
Automated Scripts or Webhooks: ELK alerts can trigger custom scripts or webhooks to automate predefined actions, such as scaling infrastructure, isolating compromised systems, or restarting faulty applications.
IT Service Management (ITSM) Integration: ELK can integrate with ITSM platforms such as ServiceNow or Jira Service Management to automatically generate incident tickets. This ensures that all incidents are recorded, monitored, and prioritized, enabling a seamless workflow for incident management and resolution.
The ELK Stack’s machine learning features, especially within Elasticsearch, provide advanced intelligence for real-time anomaly detection. By examining both historical and live data, Elasticsearch’s machine learning algorithms can uncover unusual patterns that might otherwise be overlooked. This capability is crucial for applications such as detecting unauthorized access, predicting system failures, and identifying irregular user behavior.
Elasticsearch’s machine learning module utilizes algorithms to analyze historical data patterns, enabling it to establish a baseline for "normal" behavior. Once this baseline is set, Elasticsearch can continuously monitor incoming data for deviations. As new data is ingested, the machine learning engine learns and adapts, improving its ability to distinguish between normal and abnormal patterns. This is especially useful for:
Real-Time Anomaly Detection: Elasticsearch can continuously monitor data in real-time to instantly detect anomalies, allowing for swift action. For instance, if there is a sudden surge in failed login attempts, the system can identify it as a potential security threat.
Trend Analysis and Forecasting: By analyzing historical trends, Elasticsearch can predict future patterns and identify slow-moving anomalies, such as a gradual rise in server latency or a decline in user engagement, which may indicate underlying issues.
Adaptive Thresholds: Unlike static thresholds, which can lead to false positives or missed alerts, machine learning-driven adaptive thresholds automatically adjust to evolving conditions. This reduces alert fatigue and improves the accuracy of anomaly detection.
Elasticsearch’s machine learning features are integrated through the Kibana interface, making setup straightforward:
Job Configuration: In Kibana, users create a job by selecting the data source and specifying the type of anomaly to detect, such as unusual error rates or latency spikes.
Defining Detection Criteria: Users can define conditions for the algorithm to track, such as a surge in web application errors or an unusual spike in database response times.
Alerting Integration: Anomaly detection jobs can be set up to trigger real-time alerts, enabling teams to respond promptly. These alerts can integrate with incident response tools such as PagerDuty, Slack, or custom webhooks.
Improved Security Posture: By identifying anomalous behavior that could indicate security risks, machine learning enables teams to address threats before they lead to data breaches.
Proactive Maintenance: Identifying early indicators of system issues enables teams to take proactive measures, minimizing the risk of unexpected downtime.
Enhanced User Experience: Identifying anomalies in user behavior helps uncover and resolve usability issues, enhancing both security and the overall user experience.
Reduced False Positives: Adaptive thresholds and continuous learning minimize false positives, reducing alert fatigue and enabling teams to focus on real issues.
A key strength of the ELK Stack is its distributed architecture, which allows organizations to scale monitoring and analytics in tandem with data growth. This scalability is crucial for enterprises and high-volume applications, ensuring the stack can manage increasing workloads while maintaining performance and reliability.
For enhanced automation in incident response, ELK can integrate with various tools and systems to initiate actions based on specific alerts:
By distributing data and queries across multiple nodes, the ELK Stack enables fast processing, indexing, and searching, making it ideal for real-time monitoring and analysis.
Organizations can scale their ELK deployments horizontally by adding more nodes to the cluster, offering a cost-effective and flexible alternative to vertical scaling (increasing server capacity), especially as data volumes continue to grow.
ELK’s distributed architecture provides built-in redundancy, ensuring data remains accessible even if a node fails. With multiple master and data nodes, Elasticsearch maintains high availability and minimizes the risk of data loss, allowing operations to continue smoothly during failures or maintenance.
Elasticsearch’s shard-based ecture divides large datasets into smaller, more manageable segments. These shards are distributed across nodes, enabling parallel query execution for faster search and retrieval.
Role-Based Access Control (RBAC): Define access levels within Elasticsearch and Kibana to ensure data security.
TLS Encryption and Audit Logs: Elasticsearch enables encrypted communications and auditing, essential for ensuring secure data access and regulatory compliance.
Optimize indices and mappings for enhanced query performance.
Elasticsearch Curator automates index management, optimizing performance and controlling storage costs.
Limit log collection to essential levels to reduce ingestion volume
Leverage Elastic’s monitoring tools to maintain cluster health and optimize performance.